
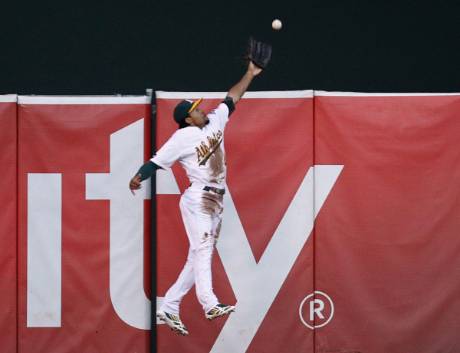
Ah, that is the question: what IS up with baseball? All the ‘usual suspects’ returned from last year to take early leads in their division. Thus far, with 1/3 of the season gone, it appears that we’ll have a repeat of the duels staged last year on the way to the World Series.
But gee whiz – doesn’t that seem vague and – oh, I don’t know – SUBJECTIVE?
In consultation with Michael the Magnificent, I have hit on an idea that just makes a whole bunch of sense. What idea is that, you eagerly ask? Well, I’ll ‘splain it to ja.
He will be coming down next weekend, loaded with lots of data on how the teams have performed thus far. We will take that data and – together – we will develop single point charts. Say, what?  Single point charts – google it…you will see.
Well, never mind that – golly gee whiz, I seem to know something others are oblivious to. So let me try to tell you what it is.
A single point chart is one that depicts the average performance of an entity in a given time frame. Boy, that clears it up big time, right? OK, smarty pants, let me try again. Let’s say you want to predict what a stock will sell for in 90 days’ time. Assuming no major upsets – cancellation of the dividend, or an overall crash, you can look at its past performance for say the last 45 days and develop an average. OK, so? You can also determine a range of values, from a low to a high, based on the standard deviation of price change from one day to the next. What good is that? It’s good for predicting upside and downside risk, for one. For another, it’s useful in things like predicting a budget for future expenditures.
OK – what does this have to do with baseball? As I mentioned above, the same teams that won their divisions last year are in first or second place this year in those same divisions. Does this past performance necessarily determine that they’ll make the play offs? That’s why we want to try to predict. And if we can predict that – we can likely predict how the whole thing will turn out, based on current performance.
But baseball wouldn’t be very interesting if you could predict the winner with only 1/3 of the season gone, right? Things change daily for all the teams. But that’s the real advantage to this. Based on when the lines cross the upper and lower limits, you can say that something has changed in the process. A new player that is adding energy to the team? Line likely goes up. A lot of key players might be injured? Line goes down.
As you get more data, the significance of the slopes become more evident. The real test will be after the division winners are declared. Can we use the charts to predict the 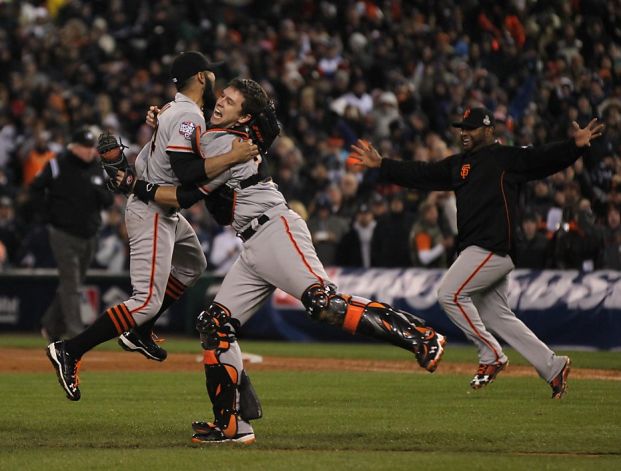 World Series winner? If it works, Michael will certainly have some interesting columns for his baseball blog. Check it out:
http://www.baseballhotcorner.com
Click on contributors and look for  Michael Theed. He’s a wonderful writer and I hope to add to his skill base in accurate predicting outcomes! We shall see…