
Now it can be told: drum roll, please!

Brrrrrrrr…Rum!
Michael came up here Thursday night, and we spent most of yesterday creating the Excel spreadsheet to analyze baseball team performance. We used a combination of a “P” chart and Bill James’  Pythagorean Expectation….whoa! What the devil are you talking about, you ask?
OK, so in my excitement I’m getting ahead of myself…
Back to the beginning. Recall in my last post I talked about doing a ‘single point chart’ to try to assess which teams were most likely to make it to the playoffs? Well, upon further inspection, I deduced that a single point chart was not the appropriate way to proceed. Why? A single point chart is good for analyzing things like accounting information. I used it for electric bill analysis to try to determine why some schools were using more electricity than others. But that really didn’t work for a baseball result: they either won or they didn’t on each game. So upon further “inspection” (little TQA joke…ah hem) and upon further reading of the  AT&T Statistical Quality Control book (the “Bible” for these things) I decided that a “P” chart was best. What’s a P Chart used for? Manufacturers would use a “P” chart to figure out the minimum and maximum number of defects coming out of batches of
 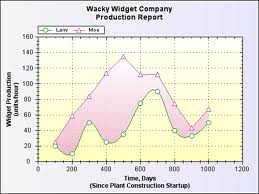 widgets. So how does that apply to baseball? Simple: a win is a ‘good’, and a loss is a ‘defect’. When you have 41 or 42 ‘batches’ (i.e. games) you can do a spreadsheet and come to some conclusion about the team’s potential to minimize losses, i.e. defects. Clear as mud, eh?
Well, nonetheless we did that and it produced some results. Then we got the Pythagorean Expectation from the Baseball-reference.com web site for each team and put that on the spreadsheet. What’s the Pythagorean Expectation? Nothing more than a calculation based on a team’s runs scored versus runs allowed.
The beauty of using these two criteria is that a) they are based on different data; and b) it provides another layer of confidence in a team’s performance as being based on their skill versus just a lucky streak. If you’re a fan, you’ll know that Atlanta had an amazing streak of wins early in the season. Luck or skill? The Pythagorean Expectation is supposed to sort that out based on the run ratio.
So without further ado, here’s the list of teams that we predict will be at the top of the list at the end of the playing season:
Atlanta Braves
St. Louis Cardinals
Boston Red Sox
Detroit Tigers
Texas Rangers
Arizona Diamondbacks
Baltimore Orioles
Cincinnati Reds
Colorado Rockies
Kansas City Royals
Again if you’re a fan, you will know that there are five American League teams and five National League teams. This is how it’s supposed to work out prior to the Playoffs. So the question will be: how close to accurate will our prognostications be? We predict an 80% accuracy.
Michael spent about 8 hours crunching all these numbers yesterday. He took to Excel like a  duck takes to the pond behind our house. So kudos to him for all his work. I’ve noted from several Google searches that nobody else is using this kind of analysis at this point in the process – or frankly at any point. I hope he writes about it and gets some attention, as he’s very knowledgeable and an excellent writer. Good combo, eh?
Note two other factoids: the  Oakland A’s, my favorite team, didn’t make the list. And the
 ![]() Miami Marlins – Michael’s favorite? Based on both sets of criteria, they are the least performing team in all of baseball. And after watching their game against Arizona last night, there ain’t much hope of improvement. Well – there’s always next year!
Miami Marlins – Michael’s favorite? Based on both sets of criteria, they are the least performing team in all of baseball. And after watching their game against Arizona last night, there ain’t much hope of improvement. Well – there’s always next year!